Seeing voltage over time
The multimeter gives you a number. But many of the most important things in electronics aren't a single number — they're a signal that changes over time: a microcontroller toggling a pin, a PWM dimming an LED, an I²C burst, the ripple on a power rail. To see those, you need the instrument that plots voltage against time: the oscilloscope.
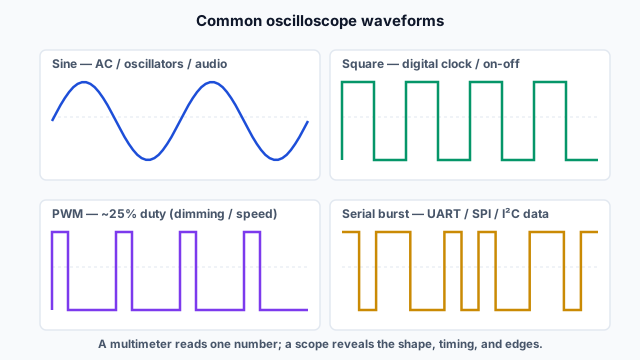
What a scope shows that a multimeter can't
A multimeter measuring a PWM signal might read "1.25V" — an average that tells you almost nothing. The same signal on a scope reveals the truth: a square wave snapping between 0V and 5V, on 25% of the time. The scope shows the shape, the timing, the edges, and any glitches — the actual life of the signal.
The core idea: a scope draws a graph with voltage on the vertical axis and time on the horizontal axis. A flat line is a steady voltage; a moving trace is a changing one. Everything a scope does builds on that one picture.
The waveforms you'll recognise
A huge part of scope fluency is simply recognising common shapes and knowing what they mean:
- Sine wave — smooth, rounded. AC mains, oscillators, audio tones.
- Square wave — sharp up/down between two levels. A digital clock (L3), an on/off signal.
- PWM — a square wave whose duty cycle (on-time fraction) varies. Dimming, motor speed, "fake analog" output (L3/L4). The on-fraction encodes the level.
- Serial data burst — irregular-looking groups of pulses: UART, SPI, or I²C traffic (L5). A scope shows the bits going by (a logic analyzer, Lesson 5, decodes them into values).
- Ripple — small wiggle riding on a DC level: the leftover AC on a power supply's output (relevant to L6).
When you can glance at a trace and think "that's a healthy 1kHz square wave" or "that PWM is stuck at 0% — the pin isn't toggling," you're using the scope as intended.
Why "over time" is the whole point
Anything fast or changing is invisible to a multimeter and obvious on a scope:
- Is the microcontroller actually outputting PWM, or is the pin dead? → scope.
- Is this clock running at the right frequency? → scope.
- Is there noise/ripple on my supply rail? → scope.
- Is the I²C line even wiggling, or is the bus silent? → scope (then logic analyzer to decode).
The scope is how you confirm that the signals you learned to create in L3–L5 are really happening. The next slide covers the three controls that make a usable picture: V/div, time/div, and triggering.
An oscilloscope shows, that a multimeter cannot:
V/div, time/div, and triggering
A scope only shows a useful picture if it's set up right. Three controls do the heavy lifting: V/div (vertical scale), time/div (horizontal scale), and the trigger (what makes the picture hold still). Get these three and you can drive any scope.
The screen is a grid of divisions
A scope screen is divided into a grid of squares called divisions (typically 8 vertical × 10 horizontal). The two scale controls set what one division is worth — in volts vertically, and in time horizontally. You're essentially choosing the zoom level in each axis.
V/div — vertical scale (volts)
V/div sets how many volts one vertical division represents. It's your voltage zoom:
- Too coarse (e.g., 5V/div for a tiny 50mV ripple) → the signal is a flat, invisible line.
- Too fine (e.g., 0.1V/div for a 5V square wave) → the waveform shoots off the top and bottom of the screen.
- Just right → the waveform fills a good portion of the screen's height, so you can see its shape and read its amplitude.
Adjust V/div until the wave uses most of the vertical space without clipping.
time/div — horizontal scale (time)
time/div sets how much time one horizontal division represents. It's your time zoom:
- Too slow (long time/div) → many cycles cram together into a solid blur.
- Too fast (short time/div) → you see only a fraction of one cycle, missing the shape.
- Just right → a few cycles of the waveform span the screen, so you can see the period and shape clearly.
Together, V/div and time/div frame the waveform so it's readable — the first thing you adjust on any new measurement.
The trigger — the key to a stable picture
Here's the control that confuses beginners and is the secret to a usable scope: the trigger.
A scope draws the waveform by sweeping across the screen repeatedly, very fast. If each sweep starts at a random point in the signal, the waveforms don't line up — you get a smeared, drifting, unreadable blur. The trigger fixes this by telling the scope: "start each sweep at the same kind of moment."
Typically you trigger on an edge at a chosen voltage level — e.g., "begin the sweep each time the signal crosses 1.5V going upward." Now every sweep starts at the same point in the waveform, so they stack perfectly and the trace freezes into a stable, still picture.
The #1 scope troubleshooting tip: if the waveform is blurry, rolling, or won't hold still, your trigger isn't set right — adjust the trigger level (and source) until it locks. A "moving" waveform is almost always a trigger problem, not a broken signal.
Putting the three together
To get a clean trace on any scope:
- V/div — zoom vertically so the wave fills the height without clipping.
- time/div — zoom horizontally so a few cycles span the screen.
- Trigger — set the level/edge so the picture stops moving and holds still.
These three turn a wall of buttons into a usable instrument. The last scope slide covers the remaining essentials — probes, coupling, and reading the waveforms you'll actually meet on real hardware.
The 'trigger' on an oscilloscope is what:
Coupling, probes, and reading real waveforms
Two more scope essentials round out the basics: the probe (and why it needs setup) and coupling (AC vs DC). With these plus V/div, time/div, and triggering, you can read the waveforms that actually appear on real hardware.
Probes: not just a wire
A scope probe connects the scope to the circuit, but it's more than a wire. Two practical points:
Ground matters. Every probe has a ground clip that must connect to the circuit's ground. The scope measures voltage relative to that ground. A floating or wrongly placed ground clip gives noisy, wrong, or even dangerous readings. Clip ground first, then probe the signal.
Probe compensation & the ×10 setting. Most probes have a ×1 / ×10 switch. The ×10 setting divides the signal by ten before it reaches the scope — which sounds unhelpful but actually disturbs the circuit less and gives cleaner high-speed measurements (the scope rescales the numbers so readings stay correct). ×10 is the usual default for general work. Probes also have a small compensation adjustment (a trimmer you tune against the scope's test square wave) so square waves look truly square rather than rounded or peaked — an uncompensated probe distorts the very shapes you're trying to read.
Coupling: AC vs DC
Each channel has a coupling setting that decides whether the DC part of the signal is shown:
- DC coupling — shows the signal as it is, including its DC level. Use this most of the time; it's the true picture (e.g., a 5V rail sits at 5V on screen).
- AC coupling — blocks the DC component and shows only the varying part, centred on zero. Use this to zoom into a small wiggle sitting on a large DC level.
The killer use of AC coupling: seeing power-supply ripple. A 5V rail might have 50mV of ripple on top (relevant to L6's regulators). On DC coupling at a sensible V/div, that ripple is an invisible thickening of the line. Switch to AC coupling and crank up the sensitivity, and the ripple blooms into a clear waveform you can measure. DC coupling for the true level; AC coupling to study the wiggle.
Reading real waveforms
With the full skill set, here's what you can now confirm on actual hardware:
- "Is the PWM working?" → scope the pin: a clean square wave at the right frequency and duty = healthy; flat line = dead pin or stuck output.
- "Is the clock running?" → scope it: a steady square wave at the expected frequency.
- "Is there ripple on the battery/charger rail?" → AC-couple the rail and look (L6).
- "Is the I²C/UART line even active?" → scope shows the bursts of activity; if it's flat, nothing's being sent (then use a logic analyzer to decode what is sent — next lesson).
Scope summary
- Shows voltage vs time — shape, timing, edges, glitches a multimeter can't.
- V/div + time/div frame the waveform; trigger holds it still (blurry = trigger problem).
- Probe: clip ground first; ×10 default; keep it compensated.
- Coupling: DC for the true level, AC to study ripple/small signals.
The oscilloscope is the instrument that connects L7 back to everything you built in L3–L6 — it's how you prove the signals and power are really doing what they should. The final lesson covers two more tools (logic analyzer, signal generator), awareness of the specialist gear, and how to choose the right instrument for any question.